Filling Data Gaps
In the Data Gap Filling module the user is able to fill a data gap for their target substance using data from analogues with a trend analysis, read-across or existing QSAR models. When selecting read-across or trend analysis, the user can further reduce the data set uncertainty by subcategorizing – removing the chemicals which differ mechanistically and/or structurally to the target chemical.
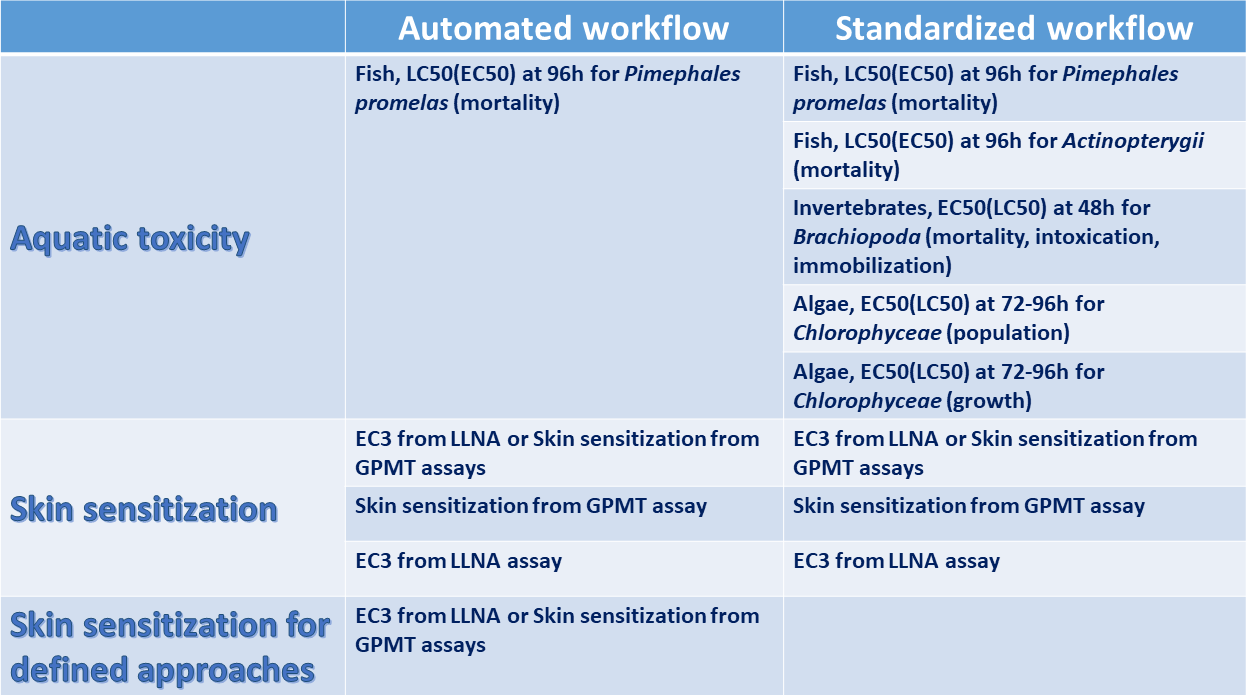
Automated and semi-automated workflows following an implemented logic for predefined endpoints (Aquatic toxicity, Skin sensitization) could be also executed.
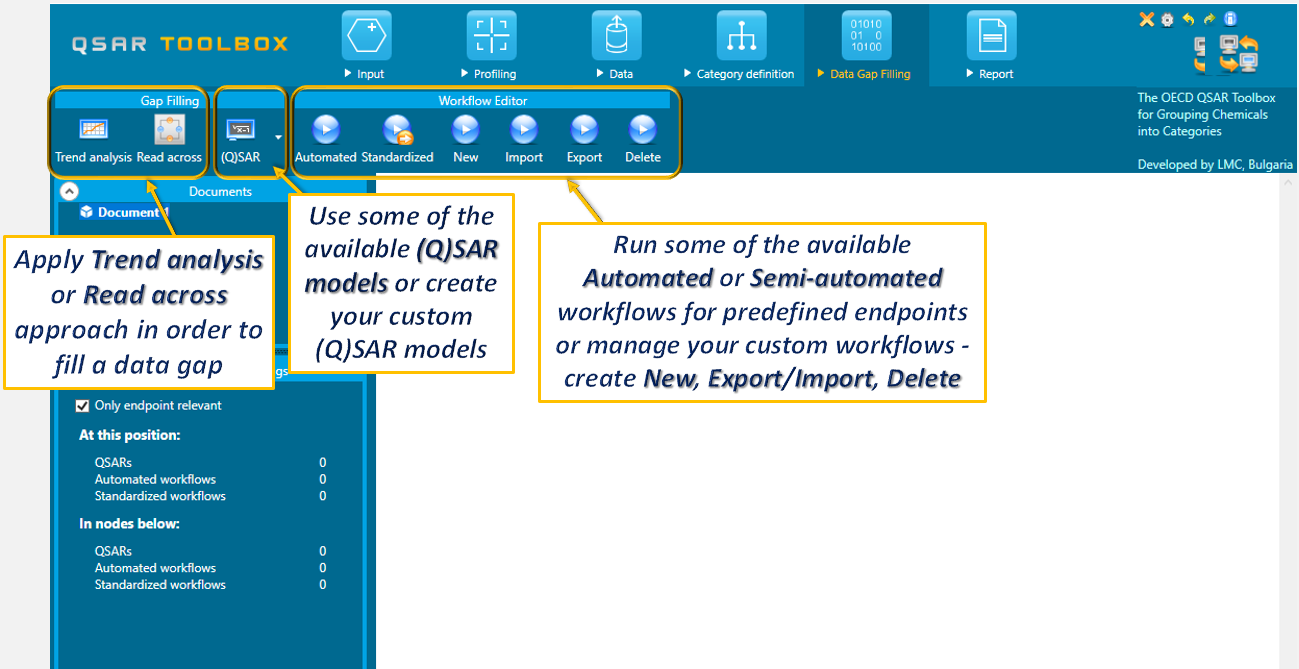
In the Data Gap Filling section the users are able to:
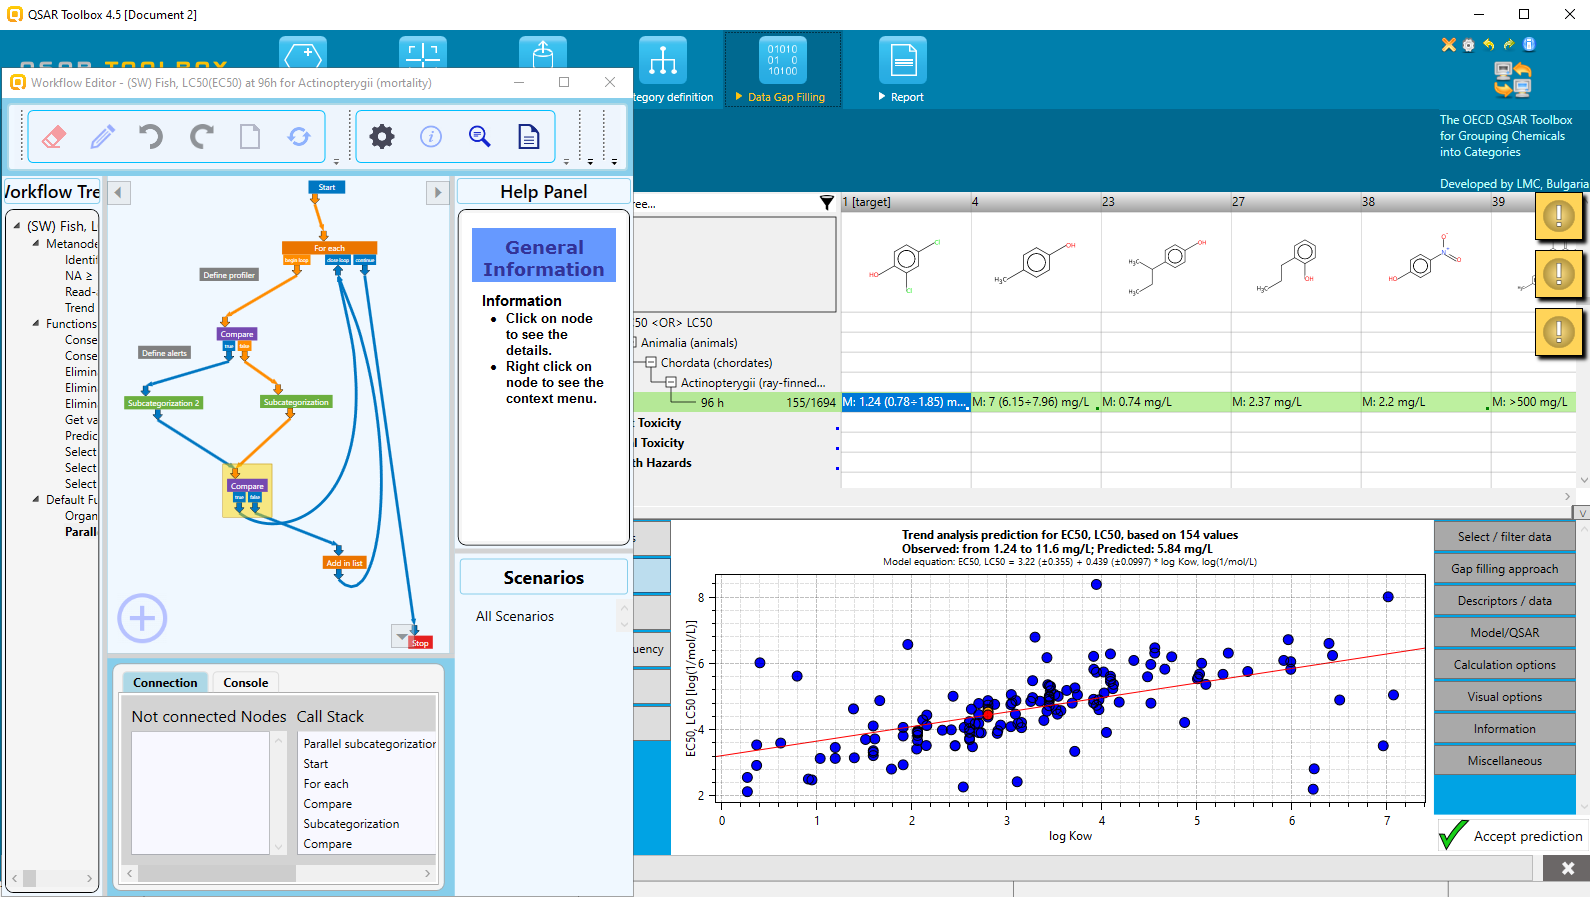
![]() Execute Automated or Standardized (semi-automated) workflow – Once the workflows are started they follow the implemented logic and finish with prediction. Same components as defined in the automated workflow (AW) are used in the standardized workflow (SW). The main difference between both workflows is that the SW pauses at each of the stages and the user is able to make different selections than those implemented in the AW.
Execute Automated or Standardized (semi-automated) workflow – Once the workflows are started they follow the implemented logic and finish with prediction. Same components as defined in the automated workflow (AW) are used in the standardized workflow (SW). The main difference between both workflows is that the SW pauses at each of the stages and the user is able to make different selections than those implemented in the AW.
The currently available workflows are listed in the table below:
![]() Performing manual workflow – fill the data gap of your target chemical by manually going through all Toolbox stages (Input, Profiling, Data, Category definition). Two approaches – read across and trend analysis could be applied based on the available experimental data for the identified analogues on the data matrix.
Performing manual workflow – fill the data gap of your target chemical by manually going through all Toolbox stages (Input, Profiling, Data, Category definition). Two approaches – read across and trend analysis could be applied based on the available experimental data for the identified analogues on the data matrix.
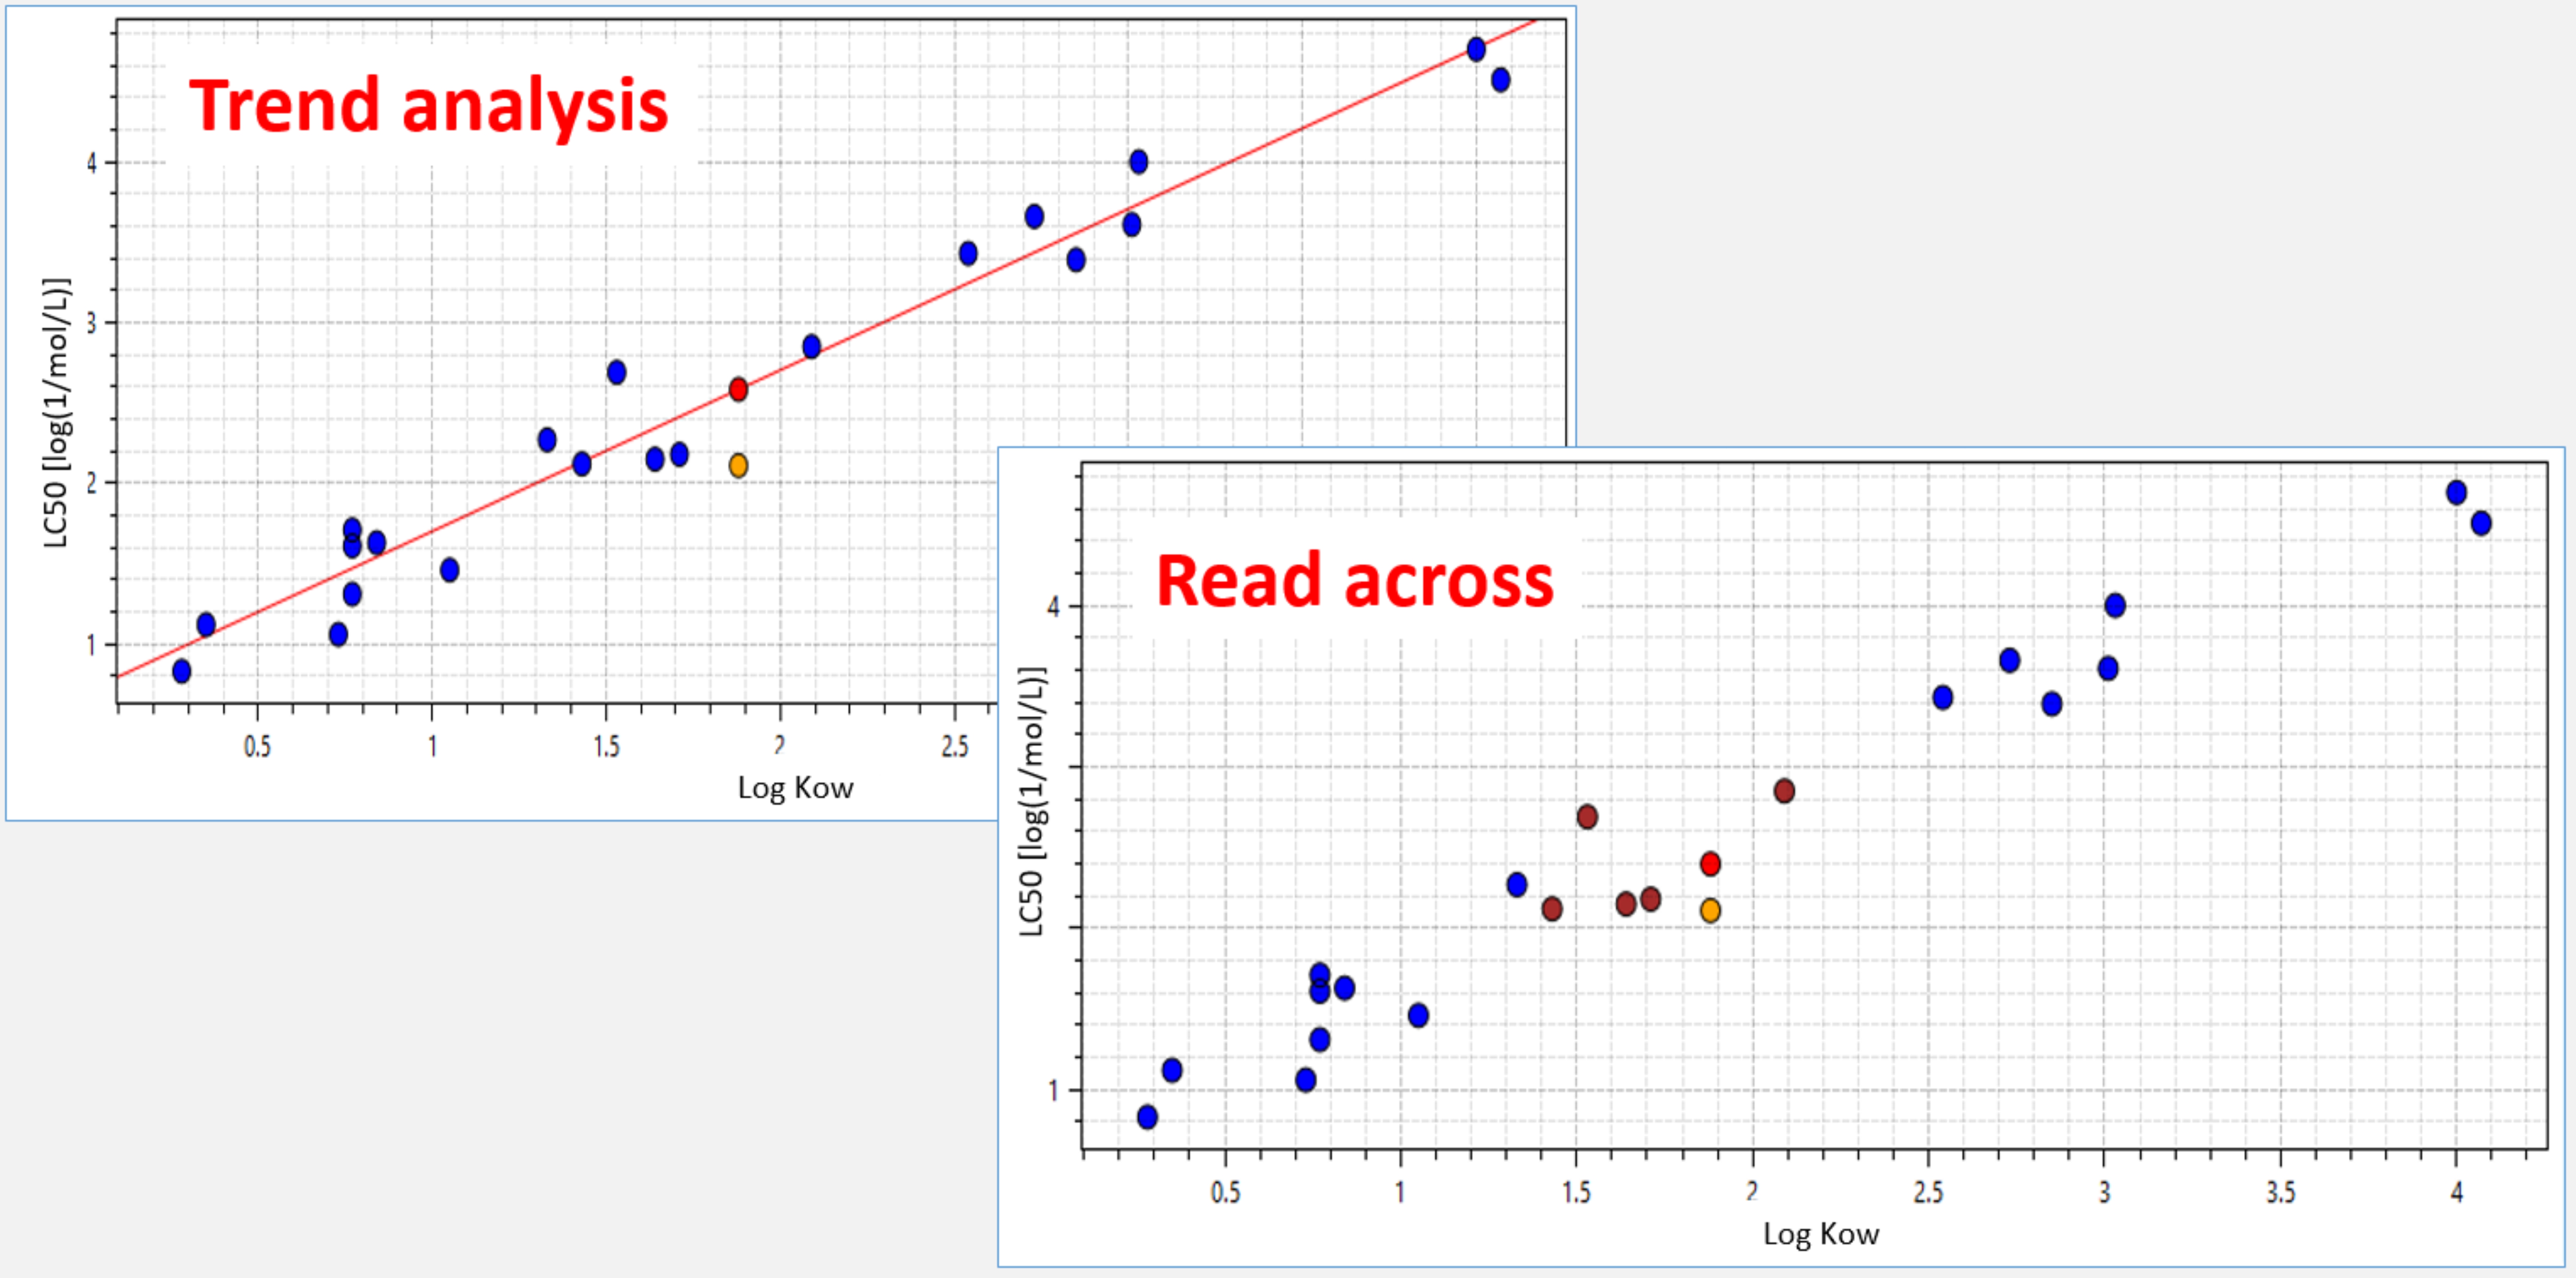
- Read-across is the appropriate data-gap filling method for “qualitative” endpoints such as skin sensitization or mutagenicity for which a limited number of results are possible (e.g. positive, negative, equivocal). The read-across approach could also be used for “quantitative endpoints” (e.g., 96h-LC50 for fish) only if a low number of analogues with experimental results are identified or a linear regression could not be justified (e.g. BOD, Repeated dose toxicity, etc.)
- Trend analysis is the appropriate data-gap filling method for “quantitative endpoints” (e.g., 96h-LC50 for fish) if enough number of analogues with experimental results are identified. The trend analysis approach is not applicable for qualitative endpoints.
![]() Make a prediction by using an external (Q)SAR model – a wide variety of (Q)SARs (902 models) for different endpoints is also available. You can use them for fast hazard assessment or collection of weight of evidences. Domain information, training and test sets are available for most of the available (Q)SAR models.
Make a prediction by using an external (Q)SAR model – a wide variety of (Q)SARs (902 models) for different endpoints is also available. You can use them for fast hazard assessment or collection of weight of evidences. Domain information, training and test sets are available for most of the available (Q)SAR models.
![]() Create a new (Q)SAR model – you can create/edit your own models for predicting properties of interest. The custom (Q)SAR models could be further disseminating by the options for exporting/importing.
Create a new (Q)SAR model – you can create/edit your own models for predicting properties of interest. The custom (Q)SAR models could be further disseminating by the options for exporting/importing.
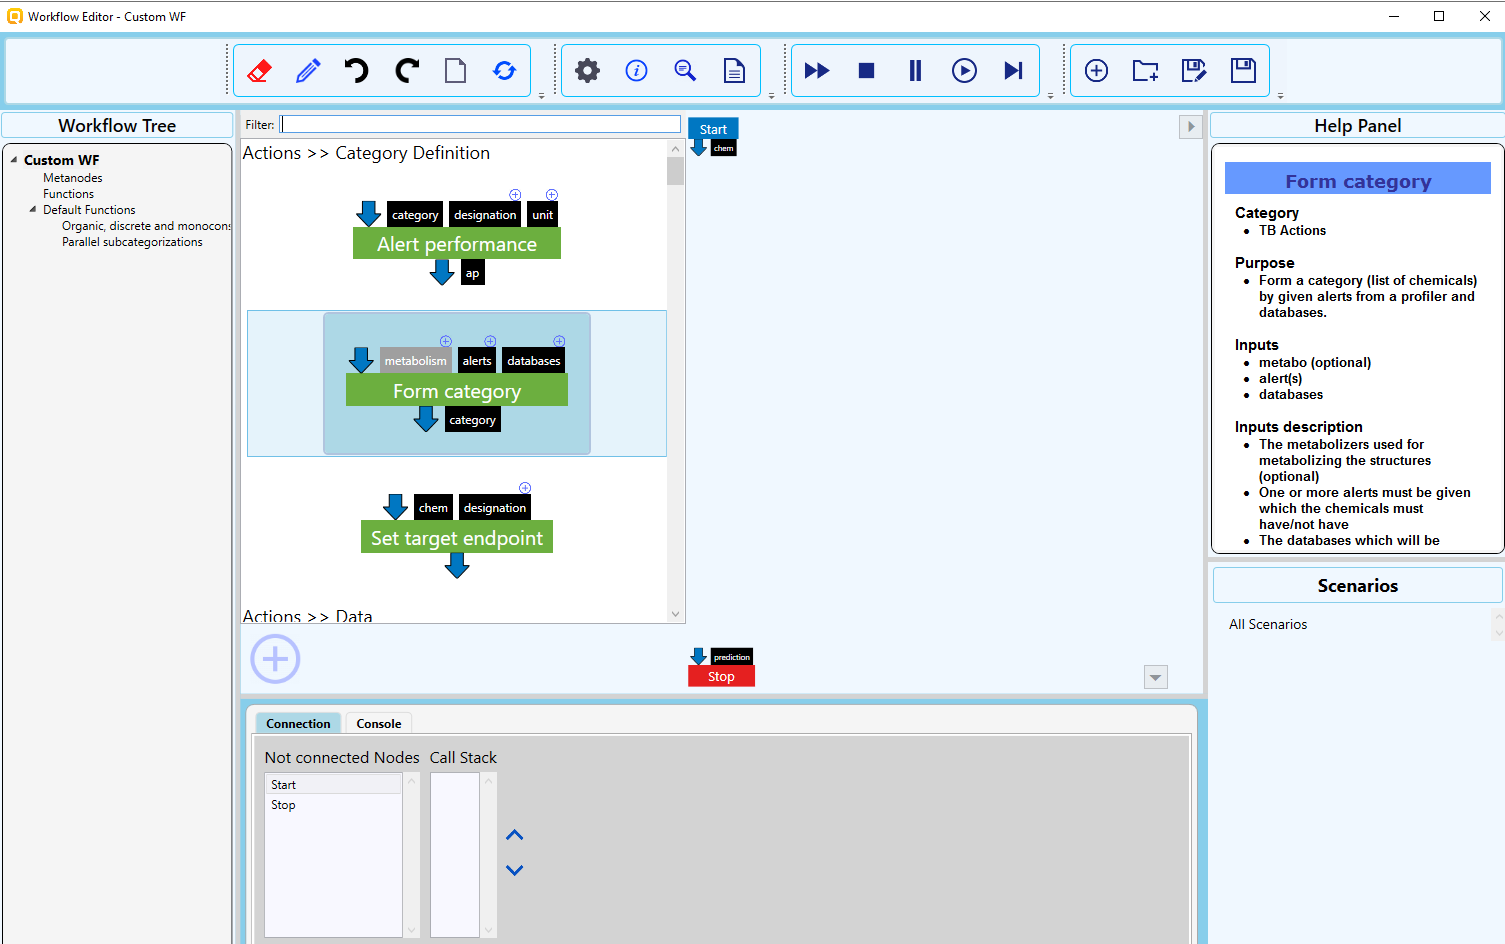
![]() Build custom automated workflows – use the Workflow editor to develop custom automated and/or standardised workflows for predicting or grouping of chemicals. Help file for the Workflow editor is also available.
Build custom automated workflows – use the Workflow editor to develop custom automated and/or standardised workflows for predicting or grouping of chemicals. Help file for the Workflow editor is also available.
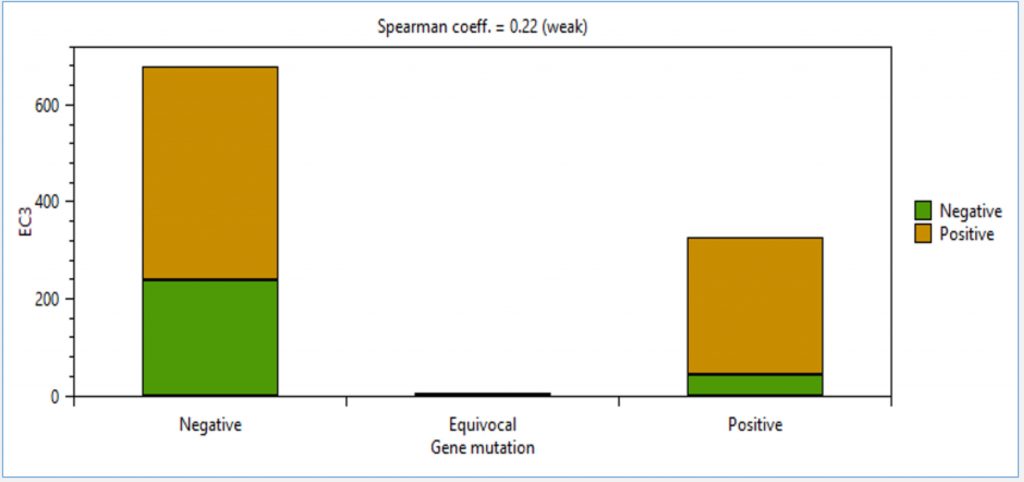
![]() Endpoint vs. Endpoint – You can see how different endpoints correlate based on the available experimental data in QSAR Toolbox.
Endpoint vs. Endpoint – You can see how different endpoints correlate based on the available experimental data in QSAR Toolbox.
E.g. Ames mutagenicity vs. Skin sensitization, EC3
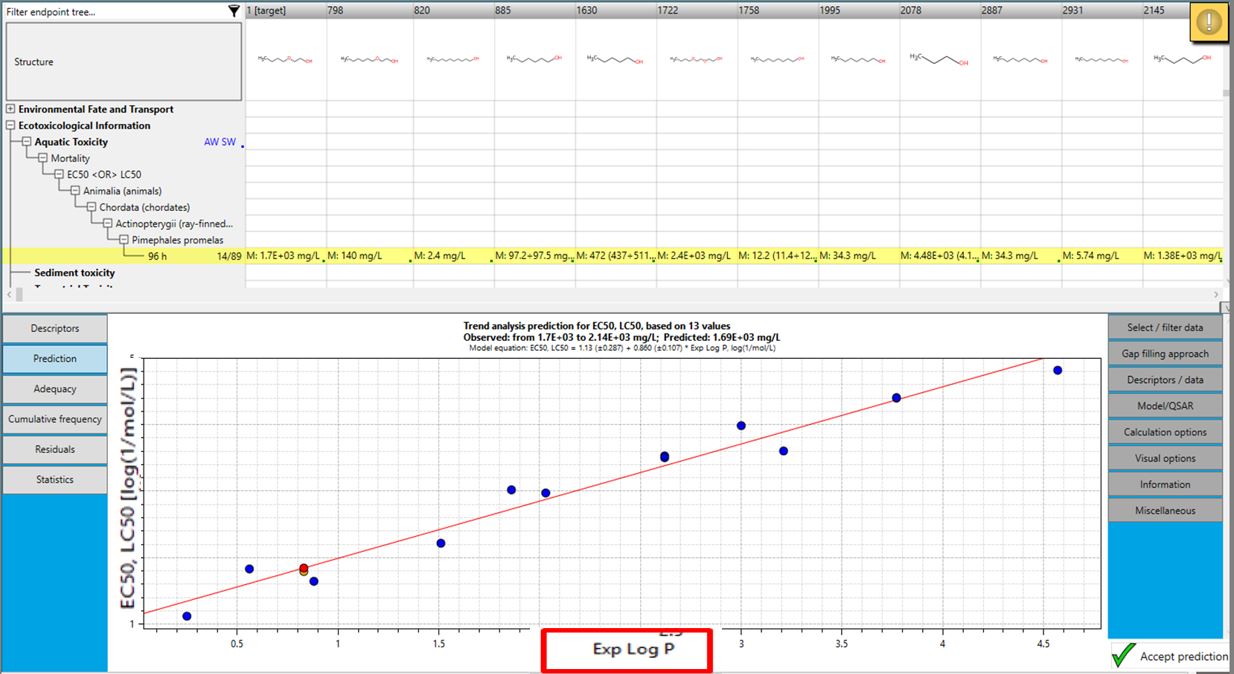
![]() Using experimental instead of calculated data – experimental physico-chemical data (e.g. logKow) could be imported in Toolbox and then used for making predictions.
Using experimental instead of calculated data – experimental physico-chemical data (e.g. logKow) could be imported in Toolbox and then used for making predictions.
